Which States Drink The Most (And Least) Beer In The US?
Which States Drink The Most (And Least) Beer In The US?
In spite of numbers that point to beer’s gradual decline since the 80’s, it still remains America’s most popular alcoholic beverage. And here’s a look at the states that consume beer the most, along with the states that disappoint…
Using numbers from Beer Marketer’s Insights over a five year period (2012-2017), 24/7 Wall St put together data on shipments of beer per capita, the metric most commonly used to indicate consumption. That data was then compiled on a state-by-state basis to show which states drink the most beer and those that drink the least…
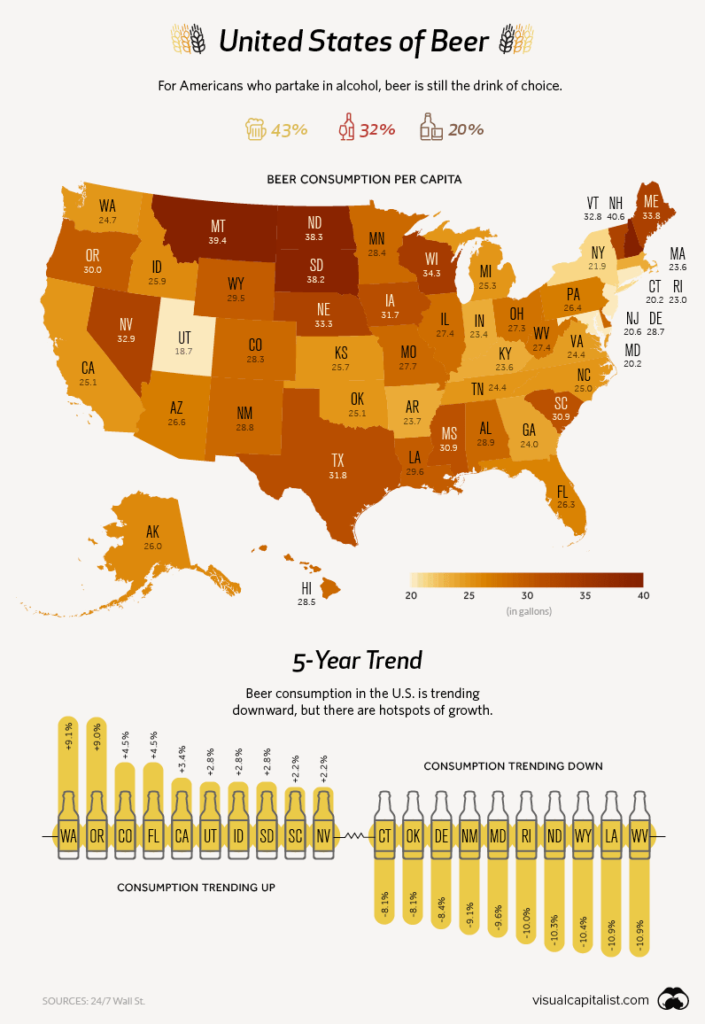
Infographic courtesy of Visual Capitalist
Thrillist reports that over that half-decade period, breweries shipped about 26.4 gallons per person in the US. But beer volumes varies widely (and wildly) from state to state.
For instance, New Hampshire residents consumed more than 40 gallons of beer per adult resident. While Utah, with its huge non-drinking Mormon community only consumed 18.7 gallons…that’s less than half as much as New Hampshire!
Here’s a look at the states that consumed the most and least beer per capita (2012-2017)
States with the highest consumption levels.
1. New Hampshire (40.6 gallons per adult resident)
2. Montana (39.4)
3. North Dakota (38.3)
4. South Dakota (38.2)
5. Wisconsin (34.3)
6. Maine (33.8)
7. Nebraska (33.3)
8. Nevada (32.9)
9. Vermont (32.8)
10. Texas (31.8)
States with the lowest consumption levels.
41. Arkansas (23.7)
42. Massachusetts (23.6)
43. Kentucky (23.6)
44. Indiana (23.4)
45. Rhode Island (23.0)
46. New York (21.9)
47. New Jersey (20.6)
48. Maryland (20.2)
49. Connecticut (20.2)
50. Utah (18.7)
About the Author: American Craft Beer
Get Social


Join Our Newsletter