
 Not all the beer news has been ‘good’ beer news lately …And news about beer reclaiming its status as America’s favorite alcoholic beverage, is always welcome whether you’re in the beer biz or just a fan.
Here’s the deal…
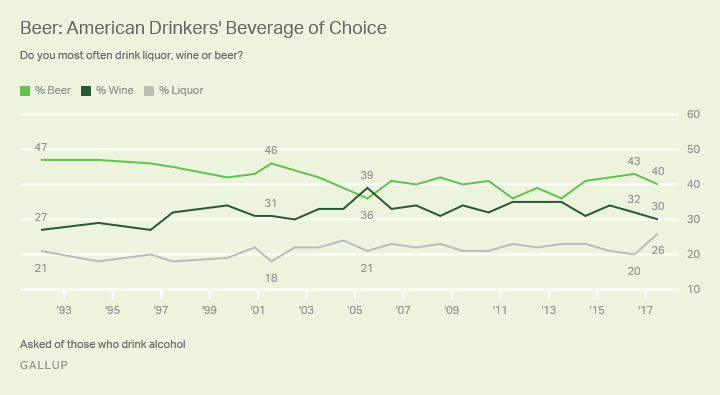
A recent Gallup poll from July 1st through the 11th has found that “Americans who drink alcohol continue to say they most often choose beer (42%) over wine (34%) and liquor (19%), good news for beer especially after wine and beer essentially tied between 2011 and 2013.”
Ever since Gallup began tracking this question in 1992. Beer has almost always been Americans’ preferred alcoholic beverage. But as the highly regarded polling company explains preferences haven’t been entirely static for the past quarter century…..
“In the mid-2000s, the sizeable advantage beer held over its next-closest alternative, wine, shrank substantially, and the two were effectively tied in 2005”
In 2013 beer (36%) and wine (35%) were close according to Gallup with younger demos (M/F 18-29) gravitating to wine. Beer re-took its top-dog status in 2014 and although things still fluctuate it’s enjoyed that place since.
In fact, Gallup found that those same “younger Americans aged 18 to 29, who turned markedly away from beer from 2011 to 2013, have become fonder of the beverage in the past five years, though not to the same extent as before 2011.”
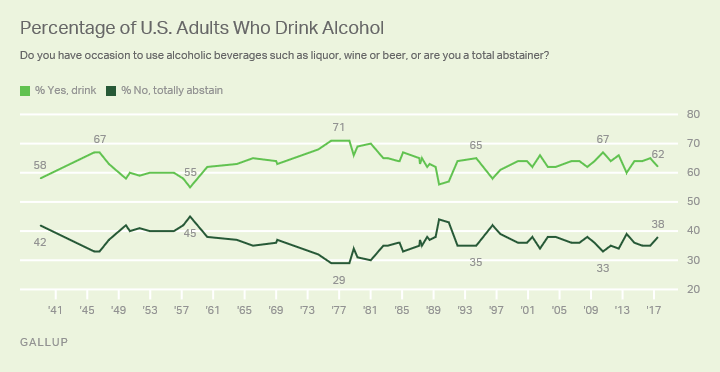
National Drinking Rate Remains Above Six in 10
In 2018, Gallup found that 63% of U.S. adults say they drink alcoholic beverages, matching the historical average since Gallup first asked this question in 1939. Slightly fewer than four in 10 Americans (36%) say they do not drink alcohol.
Percentage of U.S. Drinkers Who Prefer Beer by Selected Demographics and Time Period
| 2001 to 2010 | 2011 to 2013 | 2014 to 2018 | ||||||||||||||||||||||||||||||||||||||||||||||||||||||||||||||||||||||||||||||||||||||||||||||||||
|---|---|---|---|---|---|---|---|---|---|---|---|---|---|---|---|---|---|---|---|---|---|---|---|---|---|---|---|---|---|---|---|---|---|---|---|---|---|---|---|---|---|---|---|---|---|---|---|---|---|---|---|---|---|---|---|---|---|---|---|---|---|---|---|---|---|---|---|---|---|---|---|---|---|---|---|---|---|---|---|---|---|---|---|---|---|---|---|---|---|---|---|---|---|---|---|---|---|---|---|---|
| % | % | % | ||||||||||||||||||||||||||||||||||||||||||||||||||||||||||||||||||||||||||||||||||||||||||||||||||
| U.S. Adults Who Drink | 41 | 37 | 42 | |||||||||||||||||||||||||||||||||||||||||||||||||||||||||||||||||||||||||||||||||||||||||||||||||
| Age | ||||||||||||||||||||||||||||||||||||||||||||||||||||||||||||||||||||||||||||||||||||||||||||||||||||
| 18 to 29 | 49 | 41 | 45 | |||||||||||||||||||||||||||||||||||||||||||||||||||||||||||||||||||||||||||||||||||||||||||||||||
| 30 to 49 | 46 | 42 | 47 | |||||||||||||||||||||||||||||||||||||||||||||||||||||||||||||||||||||||||||||||||||||||||||||||||
| 50 to 64 | 35 | 33 | 42 | |||||||||||||||||||||||||||||||||||||||||||||||||||||||||||||||||||||||||||||||||||||||||||||||||
| 65 and older | 26 | 23 | 29 | |||||||||||||||||||||||||||||||||||||||||||||||||||||||||||||||||||||||||||||||||||||||||||||||||
| Gender | ||||||||||||||||||||||||||||||||||||||||||||||||||||||||||||||||||||||||||||||||||||||||||||||||||||
| Male | 57 | 52 | 59 | |||||||||||||||||||||||||||||||||||||||||||||||||||||||||||||||||||||||||||||||||||||||||||||||||
| Female | 25 | 21 | 24 | |||||||||||||||||||||||||||||||||||||||||||||||||||||||||||||||||||||||||||||||||||||||||||||||||
| Education | ||||||||||||||||||||||||||||||||||||||||||||||||||||||||||||||||||||||||||||||||||||||||||||||||||||
| College graduate | 35 | 32 | 38 | |||||||||||||||||||||||||||||||||||||||||||||||||||||||||||||||||||||||||||||||||||||||||||||||||
| Not a college graduate | 45 | 39 | 44 | |||||||||||||||||||||||||||||||||||||||||||||||||||||||||||||||||||||||||||||||||||||||||||||||||
| Yearly Household Income | ||||||||||||||||||||||||||||||||||||||||||||||||||||||||||||||||||||||||||||||||||||||||||||||||||||
| Less than $30,000 | 44 | 40 | 41 | |||||||||||||||||||||||||||||||||||||||||||||||||||||||||||||||||||||||||||||||||||||||||||||||||
| $30,000 to $74,999 | 44 | 39 | 44 | |||||||||||||||||||||||||||||||||||||||||||||||||||||||||||||||||||||||||||||||||||||||||||||||||
| $75,000 or more | 37 | 34 | 39 | |||||||||||||||||||||||||||||||||||||||||||||||||||||||||||||||||||||||||||||||||||||||||||||||||
| GALLUP | ||||||||||||||||||||||||||||||||||||||||||||||||||||||||||||||||||||||||||||||||||||||||||||||||||||
So here’s to beer. May it live long, and all of us, prosper.
And thanks to the fine folks at Gallup Polling for their data and helpful graphs.